Dynamic Reservoir Analytics Engineering Consulting
Providing Expert Analysis to Your Business

Lea County, Delaware Basin
January 2024
Lea and Eddy Counties are currently producing 29 percent of the total oil in the Permian Basin, according to data from www.eia.gov. Lea County (5,360 active horizontal wells) was selected for analysis of the Bone Spring and Wolfcamp formations to understand field development optimization strategies, identify value creation opportunities, and ultimately make informed decisions faster and more effectively. The challenge was to develop the workflows and procedures to predict quantitative, statistical, and visual models while interpreting geological targets of various quality and complexity. This study concludes that the recently drilled wells are better producers than older original wells and are a success story. It also appears that staggering wells or drilling them on tighter spacing in Wolfcamp formation demonstrates positive results. However, the Bone Spring wells are not as productive and less economic to produce compared to the Wolfcamp formation. Many geological and engineering factors effect productivity of the unconventional wells such as total organic content (TOC), thermal maturity, amount of kerogen filling pore space, fossil content type, pressure gradient, neutron porosity, water saturation, matrix permeability, rock brittleness, presence of "sweet spots" (proximity to faults and presence of natural fractures), completion design, enhanced fracture region extend, and operator's best practices. Horizontal well spacing, vertical landing in target zone (stacking and staggering), and presence of under-performing or over-performing wells also need to be carefully examined and understood. An area with approximately 400 wells and 29,000 acres was selected to be used as an illustration of the engineering analytics methodologies. The wells are located on the border of the Lea (NM) and Loving (TX) Counties in an area where the formations are thicker compared to the surrounding wells. This work was performed as an example based only on the publicly available information from the sources quoted in a Disclaimer section below and was not commissioned by a specific client. The dataset with more detailed information can be shared upon request. All privacy information (Operator, Well Name, API No., exact location) have been removed from this presentation.

Normalized Oil Cumulative (One, Two, Five Years) - Statistical Distribution

Based on the statistical distribution of the normalized and grouped together twelve initial months, two, and five years of oil production accumulation data for the wells that come online since 1/2015 and were drilled with the modern completion techniques, it appears that the latest wells (came online in 2022) exhibit a greater potential. Their one-year oil cumulative distribution is shown in orange and almost equivalent to two years cumulative for the total well sample in the study area. Out of 31 newly drilled wells in 2022, 19 of them were drilled in Wolfcamp formation next to each other with an average well spacing of 530 feet. They accumulated on average 315 Mbo in the initial twelve months of production. 4 additional Wolfcamp wells were infill drilling next to another older original producer with an average well spacing of 240 feet from each other. New wells accumulated on average 155 Mbo in the initial twelve months while older original wells accumulated on average 250 Mbo during similar time frame. These wells might be an example of the well interference. New 2023 vintage Wolfcamp wells were drilled with an average well spacing of 640 feet, but it is too early to analyze their well performance. This information can be valuable in making informed decisions regarding future well planning, especially in still undeveloped areas of the region.
Cumulative Production Type Curves - Grouped by Year
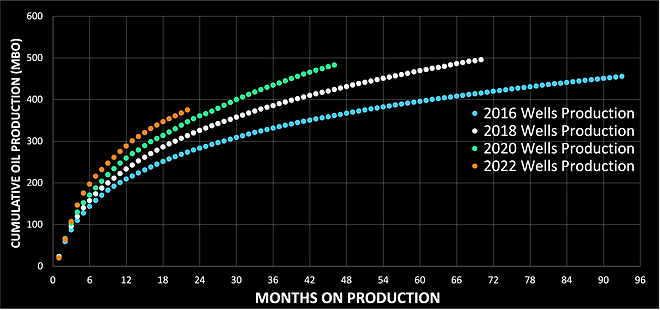
The graph above shows a positive news for the industry and producers in this area. According to the cumulative production type curves, wells are becoming more productive over time. This is attributed to a better zone targeting strategies and optimization of the completion techniques.
Cumulative Production Ratio - One Year Divided by Five Years

It seems that factors such as maximizing the initial rate by finding geologically favorable zone targets, properly horizontally spacing and/or vertically stacking/staggering locations, and optimizing fracture stimulation designs are crucial for the economic success. The decline trend in unconventional well rates is exponential. 45 percent of Bone Spring and Wolfcamp wells produce same amount of oil in the initial twelve months as they produce in the subsequent four years. Additional 25 percent of wells in both formations produce more than 53 percent in the initial twelve months out of the total five years of oil cumulation volumes.
Productivity Comparison - Bone Spring and Wolfcamp Formations
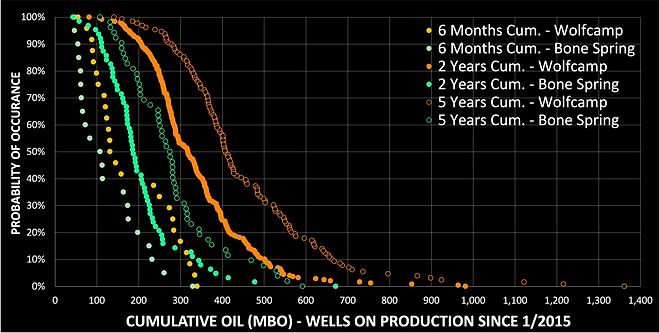
Well performance shows that Wolfcamp formation has a higher probability to produce more oil even though the Bone Spring reservoir has higher TOC content and neutron porosity values but lower normal pressure gradient. Based on the data, it appears that the Bone Spring two years oil cumulative production statistical distribution trend falls below the five years cumulative production distribution trend for Wolfcamp. This information may be useful in analyzing and comparing the performance of these two formations. Many geological and reservoir descriptions must play role in the reservoir productivity such as thermal maturity, amount of kerogen filling pore space, fossil content type, water saturation, matrix permeability, rock brittleness, presence of "sweet spots" (proximity to faults and presence of natural fractures), completion design, enhanced fracture region extend, and operator's best practices. Please refer to two geological reports about Delaware Basin that include structure and thickness maps, depositional environment explanations, lithology and mineralogy studies (click on these links: U.S. Energy Information Administration and Marine and Petroleum Geology).
Wolfcamp Formation
Neutron porosity ranges from 4% to 8%
Pressure gradient of 0.7 psi/ft
Density ranges from 2.60 g/cm3 to 2.85 g/cm3
Estimated TOC ranges from 1% to 8%
Deep resistivity ranges from 10 to 80 Ohm-meter
Bone Spring Formation
Neutron porosity ranges from 3.5% to 16.5%
Pressure gradient ranges from 0.443 to 0.455 psi/ft
Density ranges from 2.50 g/cm3 to 2.68 g/cm3
Estimated TOC ranges from 1% to 15%
Deep resistivity ranges from 12 to 35 Ohm-meter
One & Five Years Oil Cumulative - Normalized per Lateral Length

The graph above shows the average amounts of oil produced per lateral length parameters in colors for each selected group of wells. The upside of P(10) probability is shown in white. The Permian Basin has a long history of drilling with many leases held by production for decades. This has resulted in the small acreage holdings, where it is challenging to drill laterals longer than 5,000 feet. However, some operators have found ways around this issue by purchasing adjacent acreage or partnering with their neighbors. The rising costs of the completion share of the total drilling costs have also impacted the optimal lateral length, as operators focus on maximizing economics rather than commercial hydrocarbons recoverable volumes.
Initial Monthly Productivity - Bone Spring & Wolfcamp Comparison


Based on the pie chart, it is evident that 38 percent of wells drilled in both formations come online at a peak monthly rate of 40,000-65,000 barrels of oil per month. Additional 10 percent of wells in the area come online with rates higher than 65,000 barrels of oil per month and produce from Wolfcamp formation. 22 percent of wells have initial rates less than 25,000 barrels of oil per months and produce from both formations. The second graph indicates that both Bone Spring and Wolfcamp new 2022-2023 wells are better producers and have more upside potential based on the six months of oil cumulative production compared to the older original wells.
Well Spacing Comparison - Between Two Closest Producers

The graph above shows the average distance between the two closest to each other producers. It appears that the well spacing is not getting tighter at this time with limited infill drilling. One possible explanation might be that operators are drilling new wells to prove reserves and establish production analogy in the undeveloped areas.
Bubble Map - Two Years Normilized Cumulative

Based on the bubble map, it is apparent how the newer wells are strategically placed in relation to the older original wells. The bubble size represents two years of normalized oil cumulative production and placed at the center of the lateral projection path. Newer wells are shown in red and did not accumulate two years of production yet. Some of the newer wells are infill drilling, while others are the extensions to the existing pads or the additions of the new pads. The map provides a clear visualization of the relative placement of new drilling.
36 Wolfcamp Wells (Spacing <275 Feet) - One, Two, Five Years Oil Cumulative

A group of wells (36) within the study area were drilled next to each other by the same operator with an average lateral length of 12,700 feet, covering a total area of 2,480 acres. The drainage area per well is calculating to be 75 acres. Two years of oil cumulative production distribution of only these wells is shown in white for the comparison reference and suggests that they have less downside risk compared to the other wells in the study area. Additionally, production data comparison between the "parent" and the "child" wells has been conducted to provide a better understanding of the fracture hits and well interference and can be shared upon request.
22 Wolfcamp Stacked Wells - One, Two, Five Years Oil Cumulative

Arguably the Permian Basin’s defining characteristic is its stacked pay. While this atribute is not exclusive to the Permian, its magnitude of the stacked pay is considerably greater than what is seen in other unconventional plays. To provide context, the thickness of the hydrocarbon column being currently developed is over 2,000 feet in the Midland and Delaware basins, compared to 300 feet and 500 feet in the Williston Basin in North Dakota and Eagle Ford Play in South Texas. An in-depth analysis has been carried out on a group of 22 stacked wells located within the study area. The lateral length of these wells ranges between 4,100 and 10,400 feet. Two years of oil cumulative production distribution of only staked wells is shown in white for the comparison reference and suggests that they have less downside risk and upside potential compared to other wells in the study area. The development of stacked wells is challenging in practice as the flow barriers between zones are not always present. Lately, because many operators have prioritized the development of their most productive target zones, less than optimal resource recovery of the commercial hydrocarbon reserves is observed throughout the basin. The stacking, staggering, and drilling wells on a tighter well spacing requires more comprehensive understanding and detailed planning by the asset teams.
Completion Size - Volume of Completion Fluid


The first graph above shows the average amounts of completion fluid used per one barrel of produced oil in colors for each selected group of wells. The upside of P(10) probability is shown in white. Based on the data presented on the second graph, it appears that the larger completions in Wolfcamp formation with a fluid ratio greater than 2,300 gallons per foot of lateral section are better producers than smaller completions, but they are also have wider well spacing between the two closest to each other locations. It is important to note that the completion costs for these wells can constitute a significant proportion of the total drilling costs, ranging from 50 to 60 percent. Many parameters should be considered when preparing a well completion design such as the amount, type, and size of proppants, fluid volume and composition, stage length, and cluster spacing. Furthermore, the treatment should be distinctively designed for each unconventional formation depending on its geological/reservoir description and mechanical properties to achieve high recovery factors. Well completion design quality depends on the fracturability of the formation (high Young’s modulus, low Poisson’s ratio, low anisotropic closure stress), in other words the ease at which the hydraulic fractures are created and kept open. A more detailed analysis (with availability of the daily production and test data) can be performed to calculate the fracture conductivity, fracture half-length, and matrix permeability. These values would help to optimize both horizontal spacing and vertical placement of the future locations. It is imperative to use proper volumes of fluid and proppant to create complex fracture network systems with maximum contacted surface areas with the formation to ensure optimal performance of the unconventional wells and reduce capital costs.
Best 30 Percent Producers - Completion Strategy

Based on the completion data, it appears that the simulation design parameters for the best recent 2022-2023 wells include a volume of completion fluid normalized for lateral length of more than 2,200 gallons per foot and an amount of proppant normalized for lateral length of more than 2,500 lbs per foot. On the other hand, the older original best 30 percent wells were completed with a wider range of completion design parameters and achieved economic success.
Fluid Composition - GOR (Mcf/bo)

The graph above shows the average GOR parameters in colors for each selected group of wells and their P(10) probability upside in white. Wells with GOR higher than 6,000 Mcf/bo in Bone Spring formation were removed from the analysis. The concern was that the Bone Spring formation would demonstrate higher GOR values which would explain lower Bone Spring productivity.
Regional Geology - Bone Spring and Wolfcamp Formations
The Bone Spring formation consists of alternated and interbedded siliciclastic (sand), carbonate, and shale rocks. It is divided into the 1st, 2nd, and 3rd Bone Spring, each containing a package of carbonate followed by a package of sand. Above the 1st Bone Spring carbonate, there are the upper and lower Avalon shales as well as the Avalon carbonate that splits the two shales. The Avalon carbonate is interbedded with dark and carbonaceous shaly siltstones that act as a permeability barrier to vertical flow. The Bone Spring formation was deposited as submarine fan systems. The carbonates are composed of dark and dense carbonaceous wackestones and mudstones that establish an important source rock. The 2nd Bone Spring zone is the most productive, has higher peak rates, and it is thickest across the northern Delaware Basin mainly in the Eddy and Lea Counties. In the Bone Spring formation, interval porosity varies from 8 to 20 percent in the sand layers and from 1 to 4 percent in the mud layers, but all layers have very low permeability, on average less than a few mD. The Bone Spring formation reaches a maximum gross thickness of 3,400 ft. The thickest region of the formation occurs in the eastern portion of the Delaware Basin before it quickly disappears into the Central Basin Platform. Thickness of the individual sands varies from 180–500 ft. In Loving County, the Bone Spring reservoir is found at a depth range of 8,000–11,000 feet.
Well performance shows that Wolfcamp formation has a higher probability to produce more oil even though the Bone Spring reservoir has higher TOC content and neutron porosity values but lower normal pressure gradient. Other geological and reservoir descriptions must play role in the reservoir productivity such as thermal maturity, amount of kerogen filling pore space, fossil content type, water saturation, matrix permeability, rock brittleness, presence of "sweet spots" (proximity to faults and presence of natural fractures), completion design, enhanced fracture region extend, and operator's best practices. The Wolfcamp formation is generally a two-lithology based system of mostly shale with interbedded limestone. Minor layers of calcareous sandstone are present. The formation is separated into four units (A, B, C, and D) with slight mineralogy changes between the sub-units. The lithology of the Delaware Wolfcamp is analogous to the Midland Basin, but some differences do occur. Wolfcamp formation in the northwestern section of the Delaware Basin is different from the rest of the basin where carbonates are light colored dolostones. In contrast, the rest of the basin’s Wolfcamp formation are dark colored lime packstones, wackestones, and mudstones. The Delaware Wolfcamp behaves as a reservoir and source rock due to ideal mineralogy and grain size distribution. Depositional and diagenetic processes control this formation's heterogeneity. The carbonate turbidites display TOC values ranging from 0.6 to 6 percent, whereas the siliciclastic turbidites generally exhibit less than 1 percent. The interbedded non-calcareous mudstones contain as much as 8 percent TOC. The argillaceous and siliceous mudstones have effective permeabilities ranging from 10 nD to 30 nD and total porosity between 13.5 and 16.5 percent. In contrast, the effective permeabilities in laminated mudstones and siliceous wackestones and packstones range from 500 nD to 1000 nD and the total porosity is 5.5 percent. These lithofacies are heterogeneously distributed in the stratigraphic section. The argillaceous and siliceous mudstones occupy 70 percent of the thickness and thus house 90 percent of the total pore volume. The laminated mudstones and siliceous wackestones and packstones occupy only 7 percent of the thickness but are 12 to 25 times more permeable. Wolfcamp formation has an average thickness of 2,000 feet but can locally exceed 6,000 feet in the western portion of the basin. The top of the Wolfcamp reservoir in the Delaware Basin lies at an average depth ranging from 10,000 to 12,000 feet.
A primary controlling factor that affects the high rock brittleness index is a composition of the material. For example, clay or mudstone tend to be more flexible and ductile. Quartz and calcite on the other hand, with a higher density and hardness, are more brittle. In general, the siliciclastic-rich sequences exhibit the highest brittleness index and therefore geomechanical competence.

Data Sources Disclaimer
U.S. Energy Information Administration (EIA) - https://www.eia.gov
Welldatabase Production & Analytics Software - https://welldatabase.com
Frac Focus Chemical Disclosure Registry - https://www.fracfocus.org
Novi Labs - https://novilabs.com
Marine and Petroleum Geology Journal - https://www.sciencedirect.com/journal/marine-and-petroleum-geology
The American Oil and Gas Reporter - https://www.carboceramics.com/images/uploads/content/American-Oil-Gas-Reporter-Aug-2015-Customized-Frac-Stages-Improve-Completions-in-the-Bone-Spring.pdf
American Geophysical Union - https://ui.adsabs.harvard.edu/abs/2018AGUFMMR31C0091R/abstract
Enverus for Energy - https://www.enverus.com
S&P Global Commodity Insights - https://www.spglobal.com
YCHARTS - https://ycharts.com