Dynamic Reservoir Analytics Engineering Consulting
Providing Expert Analysis to Your Business

Midland County, Midland Basin
December 2023
Midland County is the most active in the Midland Basin with the highest oil production rate. This county (5,510 active horizontal wells) was selected for analysis of the Spraberry and Wolfcamp formations to understand field development optimization strategies, identify value creation opportunities, and ultimately make informed decisions faster and more effectively. The challenge was to develop the workflows and procedures to predict quantitative, statistical, and visual models while interpreting geological targets of various quality and complexity. This study concludes that the recently drilled wells are not performing as well as older original producers while being drilled with noticeably longer lateral sections. Many geological and engineering factors effect productivity of the unconventional wells such as total organic content (TOC), thermal maturity, amount of kerogen filling pore space, fossil content type, pressure gradient, neutron porosity, water saturation, matrix permeability, rock brittleness, presence of "sweet spots" (proximity to faults and presence of natural fractures), completion size, enhanced fracture region extend, and operator's best practices. Horizontal well spacing, vertical landing in the target zone (stacking and staggering), and presence of under-performing or over-performing wells also need to be carefully examined and understood. An area with approximately 380 wells and 33,600 acres was selected to be used as an illustration of the engineering analytics methodologies. The wells are located in the northern part of the county where both older and more recent drillwells are producing next to each other. This work was performed as an example based only on the publicly available information from the sources quoted in a Disclaimer section below and was not commissioned by a specific client. The dataset with more detailed information can be shared upon request. All privacy information (Operator, Well Name, API No., exact locations) have been removed from this presentation.

Normalized Oil Cumulative (One, Two, Five Years) - Statistical Distribution
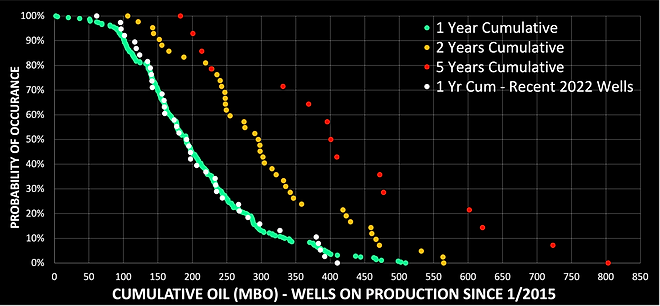

The graphs above are a statistical distribution of the normalized and grouped together twelve initial months, two, and five years of oil production accumulation data for wells that come online since 1/2015 and were drilled with the modern completion techniques. On the first graph, twelve months of oil cumulative production distribution for the recent wells (came online in 2022) is shown in white and appears to be in line with the older original producers. However, the data also suggests that 2022-2023 drillwells have noticeably longer lateral length. On the first graph, the two and five years of oil cumulative production were included for only wells that have non-allocated production being reported to the state. On the second graph, for the comparison reason, the five years of oil cumulative production shown in white includes both allocated (based on the test data) and non-allocated production. Based on the questionable accuracy of the allocated production rates, it has been decided that only the initial twelve months of allocated production will be used in this study.
Initial Monthly Productivity - Spraberry & Wolfcamp Comparison

Based on the pie chart above, it is evident that 48 percent of wells producing from both formations came online at a peak monthly rate of 25,000-40,000 barrels of oil per month. 32 percent of wells came online at a lower rate than 25,000 barrels per month. However, the Wolfcamp formation has additional wells (12 percent) that started producing at a higher rate of 45,000-60,000 barrels of oil per month.
Peak Monthly Oil Rate Distribution - Normalized for Lateral Length

The latest 2022-2023 wells are coming online with lower peak monthly rates than older producers. The graph above shows peak monthly rates distribution normalized for the lateral length (barrels of oil per 100 ft). The following study examines various geological and reservoir descriptions that may effect the reservoir productivity. These include factors such as TOC, thermal maturity, amount of kerogen filling pore space, fossil content type, pressure gradient, neutron porosity, water saturation, matrix permeability, rock brittleness, presence of "sweet spots" (proximity to faults and presence of natural fractures), completion size, enhanced fracture region extend, operator's best practices, and proximity to another fracture stimulated region causing well interference and fracture hits.
Peak Monthly Oil Rate - Grouped by Formation & Lateral Length

The graph above is another way of looking at the average peak monthly rates grouped by reservoir, vintage, and lateral length. The P(10) upside is also shown in white. The data shows the diminishing benefits in incremental productivity with the additional footage drilled in the lateral section.
Productivity Comparison - Spraberry & Wolfcamp Formations

The graph above shows six months of oil cumulative production normalized for the lateral length (barrels of oil per 100 ft). There is no noticeable difference in the productivity between the Spraberry and Wolfcamp older original producers. However, the recent drillwells are not producing as much as older wells, especially Spraberry formation.
Well Spacing Comparison - Between Two Closest Producers

Based on the graph above, it appears that the recently drilled Spraberry wells are being developed on a tighter well spacing compared to the Wolfcamp completions. Lately because many operators prioritize drilling the most productive target zones, less than optimal resource recovery of the commercial hydrocarbon reserves is observed throughout the basin. To address this issue and increase the reservoir recovery, stacking, staggering, and drilling on tighter well spacing requires a more comprehensive understanding and detailed planning by the asset teams.
Bubble Map - Two Years Normilized Cumulative

Based on the bubble map, it is apparent how the newer wells are strategically placed in relation to the older original wells. The bubble size represents one-year of normalized oil cumulative production and placed at the center of the lateral projection path. Newer wells are shown in red and did not accumulate two years of production yet. Some of the newer wells are infill drilling, while others are the extensions to the existing pads or the additions of the new pads. The map provides a clear visualization of the relative placement of new drilling.
Well Spacing - Stacked/Staggered vs. Wider Spaced Wells


The Permian Basin is known for its impressive stacked pay, which is considerably greater than what is seen in other unconventional plays. The hydrocarbon column being developed in the Midland and Delaware Basins is over 2,000 feet thick, compared to 300 feet and 500 feet in the Williston Basin and Eagle Ford Play in South Texas. In the study area, 79 wells were stacked/staggered or drilled within less than 100 feet away from each other in the same formation, with 38 of these producers drilled in the recent 2022-2023 years. However, because of the well proximity to each other and potential absence of the flow barriers between zones, the development of the stacked wells poses challenges such as potential risk of well interference and fracture hits. The distribution graphs above are Peak Monthly Rate, Peak Monthly Rate Normalized for the lateral length (barrels of oil per 100 ft), and Six Month of Cumulative Production Normalized also for the lateral length (barrels of oil per 100 ft) grouped by stacked/staggered and non-stacked wells. Based on the data, it appears that wells that were stacked/staggered or drilled at tighter well spacing (less than 100 feet) are less productive. Additionally, the recently stacked/staggered wells are not performing as well as the older original stacked/staggered producers. In the study area, both Spraberry and Wolfcamp formations have stacked/staggered wells that were drilled and came online at the same time. There is no "parent" and "child" relationship between them. 18 out of 38 stacked/staggered wells were drilled in close proximity (less than 200 feet) from the already existing producers in the same zone. The possibility of well interference needs to be addressed to make sure that these wells are not experiencing typical reduction in EUR potential caused by the infill drilling. The analysis shows that there is no significant difference in GOR between the different groups of wells, suggesting that the wells were not drilled in higher GOR zones or areas. Further analysis and investigation may be required to identify potential issues with the reduced productivity performance.
Infill Well Drilling - Well Interference Based on Peak Monthly Oil Rate

Based on available data, it seems that the 18 newly drilled stacked/staggered wells marked in red are likely experiencing well interference with the older original wells within less than 200 feet away because of the way they are distributed on the statistical probability distribution trend. Therefore, it can be concluded that the infill drilling interference cannot be excluded from a list of the possible causes of the lower productivity but there are other factors also influencing well performance.
Completion Size - Volume of Completion Fluid Normalized for Lateral Length


Based on the data analysis of the study area, it appears that the rising costs of completion share of the total drilling costs are impacting the optimal completion parameters. Operators are focusing on maximizing economics rather than commercial hydrocarbon recoverable volumes. The first graph shows that stacked wells are completed with a greater fluid to lateral length ratio than non-stacked wells. Both stacked and non-stacked producers do not show an upside in completion fluid volume per lateral length and producing noticeably less oil per volume of injected fluids. This appears to be industry trend because these wells were drilled by four different operators and completed by three different service companies. Based on the data presented on the second graph, it appears that the larger completions with a fluid ratio greater than 2,300 gallons per foot of lateral section marked in black are not necessarily performing better than smaller completions. The reservoir engineers may need to pay closer attention to the completion parameters as the completion costs of the unconventional wells account for 50-60 percent of the total drilling costs. Many parameters should be considered when preparing a well completion design such as the amount, type, and size of proppants, fluid volume and composition, stage length, and cluster spacing. Furthermore, the treatment should be distinctively designed for each unconventional formation depending on its geological/reservoir description and mechanical properties to achieve high recovery factors. Well completion design quality depends on the fracturability of the formation (high Young’s modulus, low Poisson’s ratio, low anisotropic closure stress), in other words the ease at which the hydraulic fractures are created and kept open. A more detailed analysis (with availability of the daily production and test data) can be performed to calculate the fracture conductivity, fracture half-length, and matrix permeability. These values would help to optimize both horizontal spacing and vertical placement of the future locations. It is imperative to use proper volumes of fluid and proppant to create complex fracture network systems with maximum contacted surface areas with the formation to ensure optimal performance of the unconventional wells and reduce capital costs.
Completion Size - Proppant to Completion Fluid Ratio

The recently drilled stacked wells are located in the different locations in the study area but have similar and very narrow range of the proppant to completion fluid ratio. This graph above also reiterates the fact the recent non-stacked completions were drilled with noticeably higher proppant to completion fluid ratio that older original producers. It appears that in addition to a potential risk of well interference and fracture hits, these wells might not have optimized completion parameters for the geological settings, reservoir quality, and the lateral length.
Lateral Length Distribution

More recently drilled wells are being developed with longer lateral sections. Operators practically stopped drilling wells shorter than 10,000 feet. But this practice is resulting in the diminished benefits to drilling incremental footage of the lateral sections because an incremental footage in the lateral length may not yield a proportional oil recovery per foot compared to the shorter laterals. As operators prioritize maximizing economics over commercial hydrocarbon recoverable volumes, they may be opting to save money on the completion costs and techniques.
Best 30 Percent Producers - Completion Strategy

Bottom 30 Percent Producers - Completion Strategy

The two graphs above show completion parameters for the top and bottom 30 percent producers. There is no noticeable difference in the completion design being used between these two groups of wells. As it was mentioned earlier, many reservoir, geologic, and completion factors will impact well performance such as TOC content, thermal maturity, amount of kerogen filling pore space, fossil content, pressure gradient, neutron porosity, water saturation, matrix permeability, rock brittleness, presence of "sweet spots" (proximity to faults and presence of natural fractures), completion size, enhanced fracture region extend, and operator's best practices, and proximity to another fracture stimulated region causing well interference and fracture hits. The impact of each parameter is a piece of a complex puzzle to understanding and predicting the future performance of the unconventional wells.
Regional Geology - Spraberry and Wolfcamp Formations

Siltstones, very fine-grained sandstones, mudstones, and argillaceous limestones comprise Spraberry formation. The Spraberry formation is a naturally fractured reservoir with low porosity and low matrix permeability. These qualities, along with a natural fracturing tendency, provide migration paths and a trap for hydrocarbons. Factors controlling reservoir quality can be divided into depositional and post depositional. Depositional influence includes original rock materials, sorting, mineralogy, presence of clays and also sedimentary structures such as burrows. The impact of diagenetic features such as compaction, cementation, mineral dissolution, and fractures also contributed to changes in reservoir quality. Many of the siltstones are laminated and mixing with sandstones frequently, reducing overall reservoir quality. However, more massive sandstones occur, most often in stacked or amalgamated channels. Thin, laterally continuous black shales with high TOC content are also present. Based on the regional stratigraphic correlation and percentage of sandy content, the formation consists of three genetic stratigraphic sequences, known as the Spraberry Upper, Middle, and Lower benches. The Upper and Lower benches have thicker and more widely spread siltstone and fine-grained sandstone layers with intermitted silty shale, whereas the Middle bench is composed of the calcareous shale, limestone, and thinner more locally developed fine-grained sandstones, The Spraberry formation appears to represent a large scale, basin floor submarine fan system consisting of stacked fan series. Fan deposits are cut by a succession of the narrow channels comprised of the clastic flow material. The fine grained and mud rich fan complex of the Spraberry is found to have an abundant sediment supply through its extensive network of leveed channels. The Spraberry formation represent a distinctive depositional system, wherein carbonate sediment is mainly generated and conveyed throughout the basin during sea level highstands and clastic sediment is deposited during sea level lowstands. Porosity measured varied from 2 percent in rocks with poor reservoir quality such as the argillaceous siltstone and mudstone while good reservoir rocks had an average porosity of 9 percent. The low permeability can be attributed to such factors as presence of illite in pore space, silt size particles in pore throats, diagenetic effect, quartz overgrowth, and presence of calcite in pore spaces. The entire section from the top of the Spraberry to the base of the Dean varies in thickness between 1,200 and 1,870 feet. The average depth of the top of the Spraberry formation is approximately 6,800 feet across the entire sub-basin.
Spraberry Upper Unit
Neutron porosity ranges from 7% to 22%
Density ranges from 2.44 to 2.60 g/cm3
Estimated TOC ranges from 2% to 8%
Deep resistivity ranges from 20 to 290 Ohm-meter
Spraberry Middle Unit
Neutron porosity ranges from 6% to 20%
Density ranges from 2.45 to 2.61 g/cm3
Estimated TOC ranges from 1.2% to 7%
Deep resistivity ranges from 12 to 275 Ohm-meter
Spraberry Lower Unit
Neutron porosity ranges from 5.5% to 16.5%
Density ranges from 2.48 to 2.62 g/cm3
Estimated TOC ranges from 1% to 7%
Deep resistivity ranges from 14 to 260 Ohm-meter
The Wolfcamp formation is generally a complex unit consisting of two-lithology based system of mostly shale with interbedded limestone. Minor layers of calcareous sandstone are present. This formation is separated into four units known as the Wolfcamp A, B, C, and D. The four zones of the Wolfcamp formation display different characteristics in terms of lithology, fossil content, porosity, TOC, and thermal maturity. Depth, thickness, and lithology vary significantly across the basin. Depositional and diagenetic processes control this formation’s heterogeneity. The average permeability is as low as 10 millidarcies. Shallow-water shelf facies consist of mixed shale, carbonate, and lime mudstone. Basinal sediments include dark shale, lime mudstone, and carbonate debris. Carbonate detritus from the shallow shelf was delivered to submarine valleys and formed a succession of fan systems. Fan deposits are cut by a series of narrow channels consisting of clastic flow material also derived from the shelf. The presence of deep water dark organic rich shales interbedded with siliciclastic sediments indicates that debris and channel deposition advanced into the area during times of sea level lowstand. It is interpreted that the majority of gravity flows occurred during lowstands of relative sea level. During sea level lowstands, platforms were exposed, and siliciclastic material was conveyed directly into the basin. During sea-level highstands, sediment input to the basin comprised platform-derived carbonate, aeolian silt, and clay. A siliciclastic series includes the lower Wolfcamp interval. This low stand interval contains submarine fan deposits that extend across the basin floor. The lower Wolfcamp interval forms west and north thinning wedge of siliciclastic sediments transported from highland source areas to the east and south. A calcareous series includes the upper Wolfcamp interval. This highstand interval contains widespread alternating layers composed of calcareous mudrock and detrital carbonate deposits. Calcareous layers are predictably thicker near the platforms that provided the carbonate detritus. In the central parts of the basin, calcareous intervals are mudrock dominated and include thin and permeable reservoir of coarse-grained siliciclastic material. The carbonate turbidites display TOC values ranging from 0.6 to 6 percent, whereas the siliciclastic turbidites generally exhibit less than 1 percent. The interbedded non-calcareous mudstones contain as much as 8 percent TOC. Wolfcamp thickness ranges from about 800 ft to more than 7000 ft in the Delaware Basin. The Wolfcamp formation is the deepest in the center of the basin, measuring approximately 12,000 feet deep, whereas towards the edges of the basin, it is found at a much shallower depths varying from 4,000 to 7,000 feet.
Wolfcamp A Unit
Neutron porosity ranges from 7% to 22%
Density ranges from 2.45 to 2.60 g/cm3
Estimated TOC from 2% to 8%
Deep resistivity ranges from 20 to 290 Ohm-meter
Wolfcamp B Unit
Neutron porosity ranges from 6% to 20%
Density ranges from 2.45 to 2.61 g/cm3
Estimated TOC ranges from 1.2% to 7%
Deep resistivity ranges from 12 to 275 Ohm-meter
A primary controlling factor that affects the high rock brittleness index is composition of the material. For example, clay or mudstone tend to be more flexible and ductile. Quartz and calcite on the other hand, with a higher density and hardness, are more brittle. In general, the siliciclastic-rich sequences exhibit the highest brittleness index and therefore geomechanical competence.
Please refer to three geological reports about Midland Basin that include structure and thickness maps, depositional environment explanations, lithology and mineralogy studies (click on these links: U.S. Energy Information Administration, Enverus Blog, ProQuest Research).
Data Sources Disclaimer
U.S. Energy Information Administration (EIA) - https://www.eia.gov
Welldatabase Production & Analytics Software - https://welldatabase.com
Railroad Commission - https://www.rrc.texas.gov/oil-and-gas
Frac Focus Chemical Disclosure Registry - https://www.fracfocus.org
Novi Labs - https://novilabs.com
Enverus for Energy - https://www.enverus.com
S&P Global Commodity Insights - https://www.spglobal.com
ProQuest - https://www.proquest.com
YCHARTS - https://ycharts.com